SEJournal Online is the digital news magazine of the Society of Environmental Journalists. Learn more about SEJournal Online, including submission, subscription and advertising information.
 |
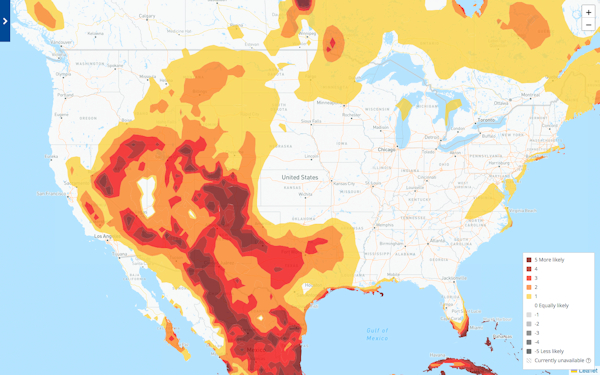
| A Climate Shift image from July 18, 2022, showing high index values where climate change made the hot temperatures more likely. Image: Climate Shift Index website. |
Reporter’s Toolbox: Temperature Shift Tool May Help Journalists Clarify Climate Impacts
By Joseph A. Davis
Hotter days are coming. Trust us on this one. If you are an environmental journalist, you may well be writing about the heat by late June (or earlier).
There’s a tool that may help. It’s called the Climate Shift Index. It helps pick out the part of the godawful, unseasonable, unbearable heat that is attributable to climate change.
It comes from Climate Central, a nonprofit nongovernmental and nonpartisan organization that works a lot with journalists — especially broadcast meteorologists. It is an odd duck: committed to sound science but functioning in some ways as a media relations outfit.
Whether a database can overcome climate skepticism is another matter.
Where the data come from
It’s not data, actually. It’s modeling. But the modeling does help you answer the question of how much of that extreme heat is coming from climate change.
Climate scientists have relied on
modeling for decades to spell out
the consequences of what they know.
Wait before you dismiss modeling. Climate scientists have relied on it for decades to spell out the consequences of what they know. What they know is basic physics and bazillions of instrumental measurements. But climate change needs to be thought about in probabilistic terms.
Statistics are one of the key tools for thinking about weather — even what weather may be coming a day ahead. Broadcast meteorologists use modeling every day to advise you on whether you will need an umbrella.
Here’s an explainer for how the Climate Shift Index is computed. It’s a complicated mix of two methods. One of them, as the site explains, “uses 22 climate models each run with, and without, historical greenhouse gas emissions. We then calculate the frequency of the temperature in the modeled climates. This gives us 22 pairs of frequencies. We then take the ratio of the frequency in the runs with observed CO2 to the frequency in the run without extra greenhouse gasses.”
How to use the index smartly
The helpful thing about the Climate Shift Index is that it allows you to focus on specific days and specific places (although it is computed for worldwide events, too).
Another helpful thing about the index is that it gives you maps. This is good if you are a TV meteorologist or a journalist whose editor demands graphics.
Graphically and otherwise, the index gives you a number meant to express the probability of a particular day’s excess temperature being attributable to climate change.
We would encourage journalists to use it in conjunction with other tools intended to describe unusual weather. The National Weather Service and the National Centers for Environmental Information — both under the National Oceanic and Atmospheric Administration — offer info about record-breaking temps that is intuitive.
You will find temperature shift info more meaningful if you discuss it in terms of other climate change impacts — whether drought, wildfire, storms, flooding or even unusual cold.
[Editor’s Note: Read more about the science of climate attribution, plus see our Topic on the Beat: Climate Change page and our Climate Change Resource Guide, including its Climate Science 101 section.]
Joseph A. Davis is a freelance writer/editor in Washington, D.C. who has been writing about the environment since 1976. He writes SEJournal Online's TipSheet, Reporter's Toolbox and Issue Backgrounder, and curates SEJ's weekday news headlines service EJToday and @EJTodayNews. Davis also directs SEJ's Freedom of Information Project and writes the WatchDog opinion column.
* From the weekly news magazine SEJournal Online, Vol. 8, No. 19. Content from each new issue of SEJournal Online is available to the public via the SEJournal Online main page. Subscribe to the e-newsletter here. And see past issues of the SEJournal archived here.


 Advertisement


